
While coaching drivers, I often get the comment, “I should consider starting to understand my data,” or, “I need to better utilize the data acquisition that I have.” This is a great sentiment, because exploring data can unlock a world of improvement on the track. Data can be daunting and difficult to understand, though, especially if you plunge into the deep end immediately. Go for it, but start with the basics.
Some drivers use their data acquisition software as a lap timer. That works well but defeats the purpose of spending the time and money on a tool. In essence, it’s like using a microwave exclusively as a clock.
I share tons of complex data analysis with my clients, but here are a few easy tips for the untrained eye about how to interpret those squiggly lines.
Search for flat lines
You’ve taken the first step in downloading the data. Most immediately move to looking at a speed trace, which examines the vehicles speed on the vertical axis and the distance on the horizontal axis. Good start, but do you know what you should be looking for?
As you may assume, where you see the speed go up, you’re accelerating. Conversely, where the speed is going down, you’re braking.Most of the potential for lap time improvement lies in the time between the two.
Look for anywhere the speed trace plateaus and stays flat for an extended length of time (preferably for 1-2 seconds, excluding long straightaways where the car is maxed out on speed). If the line is flat, this means you’re either coasting or—more likely—using maintenance throttle, which is when you’re maintaining the speed of the car at less than full throttle.
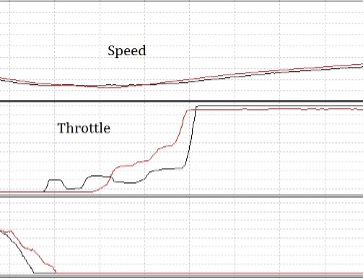
Note the red throttle trace. Being more patient to reach initial throttle enables full throttle (wide-open) sooner. Also, note the speed trace above reflecting exit speed advantage, as well.
This flat line is a red flag for where there is time improvement potential: if you jumped back to throttle but can’t commit to full throttle, then generally this means you’ve committed to your initial throttle input too soon. In other words, be more patient so that when you do pick up the throttle, you can squeeze it to full rather than having to “maintain” that reduced throttle.
A wise racer once said, “It’s not the driver who gets to power first that wins, it’s the driver who gets to full power first that wins.” You’ll find that being patient will result in achieving wide-open throttle sooner than the driver who went to initial power first.
Flat Slope
The other thing to consider when looking at a speed trace is the slope of the line under deceleration. The strength of your braking will change how dramatically the line slopes. If that line isn’t consistent in heavy braking zones, you know there’s room for improvement in consistency and efficiency. If the slope of the line isn’t linear (flat) all the way to the corner, that’s a red flag. This means that your brake pressure is varying in that brake zone, and therefore not maximizing your car’s braking potential.

U-Shaped versus V-Shaped
The final tip to consider is the shape of your speed trace in the corner. Is it U-shaped or V-shaped? The advantage of a U-shaped speed trace is that you’re releasing brake pressure in a way that carries momentum into the corner and down to the apex. The car is maximizing its cornering potential before you squeeze the throttle again. A V-shaped trace, on the other hand, means you are hard on the brakes all the way to the point that you can jump back onto full throttle. Although this sounds like the optimal way to corner—either on the brakes or on the gas with no coasting—this doesn’t maximize the car’s cornering speed potential. When diving deep into data, overlaying a V over a U shows that the U ends up having a higher minimum speed, and that results in a quicker corner sector for a faster lap.
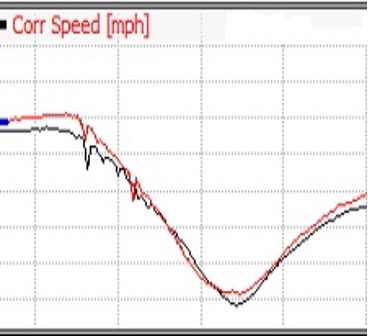
Note the “U” vs “V” shape. With the U-shaped trace (red line), we can carry more minimum speed and better exit speed This is achieved through smoother,lighter brake release, rolling momentum through the apex.
These quick, simple tips will allow you to interpret your speed trace and determine if there are opportunities for improvement. In times when you might not have a coach or an additional data point reference to overlay in comparison, or you’re simply overwhelmed by the data (it happens to us all), revisit these three speed trace basics.
Tom Long is an accomplished sports car driver, coach, and development driver. With more than 150 professional starts, Tom has accrued over 20 wins and 40 podium finishes in IMSA/GrandAm competition. Last season, he drove in the IMSA Michelin Pilot Challenge Series GS GT4 class and the IMSA Lamborghini Super Trofeo Series. -ed


