Miata Is Always The Answer for a lot of reasons, but aerodynamics isn’t one of them. Case in point: In 1993, the Mazda Miata had drag coefficient of .38, while the Mazda RX-7 of the same year was .29. A practical way of looking at that difference is, if Mazda swapped the RX-7 body onto the Miata chassis, it would have gone 10 mph faster.
Some of that drag is related to the front end, which is more cute than functional. The convex shape of the nose directs air under the car, creating lift—and drag. The front tires are also exposed to airflow, which is particularly bad when they are rotating.
Mazda improved the Miata’s aerodynamics with each generation, but the convertible top meant airflow over the roof would always be a problem. Since it must fold away nicely, the canopy is both shorter and wider than a purpose-built coupe or fastback. This makes it difficult for air to reconnect smoothly in the wake of the canopy. More drag. Now that isn’t a big concern on a street car, especially one that’s supposed to put its top down, but how air interacts with the body is important when racing.
Racing improves the breed, and as everyone knows, many Miatas went racing.
Unfortunately, the rampant popularity of Spec Miata racing did nothing for Miata aerodynamics, except delay it. There was some aero experimentation happening in other series, especially in Japanese time trials. Thirty years on, we’ve settled into a more homogenized look of what a track Miata should look like: vertical airdam, splitter, and wing. This aero package addresses the most critical aspects of Miata aero, except the roof.

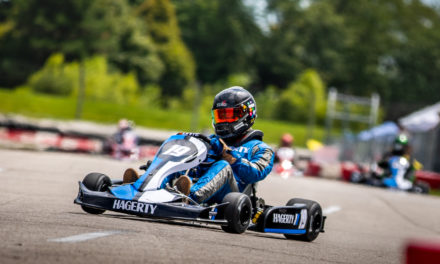
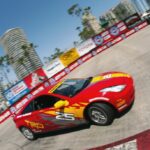
Typical track Miata
Aftermarket companies produced lighter hard tops, but not much in a different shape. Fastbacks are rare, and the DIY versions are as individual as their designers. And because of that, fastbacks are hard to quantify. Look at the rulebooks of various racing organizations and a fastback could put you in an unlimited class, make your car outright illegal, or in some cases there’s not penalize you at all. The one thing you can glean from all this is that nobody really knows, performance-wise, what a fastback is worth. The fastback mystery is how I got started in aerodynamic testing.
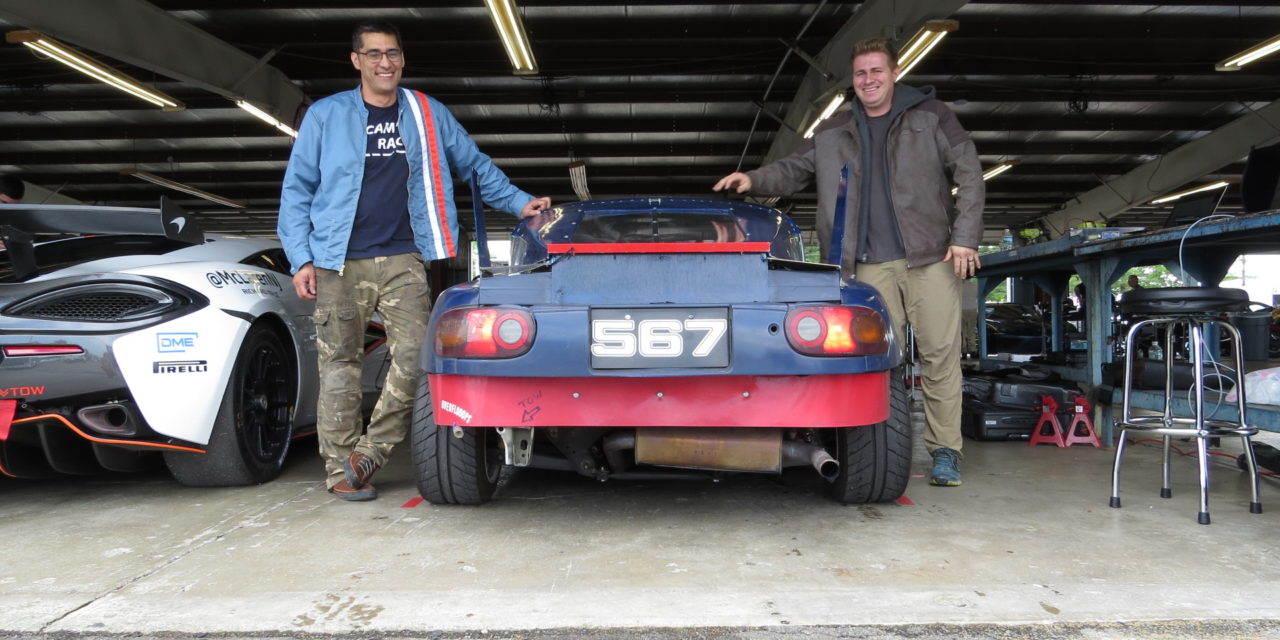
I have a background in programming, and it wouldn’t be a huge leap for me to jump into computation fluid dynamics (CFD). However, the close proximity of Watkins Glen International and a bit of luck meeting the right people got me started down the path of real-world testing. It began when I attempted to drum up interest on the Miata Turbo site, stating my intentions, and trying to garner support from Miata enthusiasts. There, I met Jeremiah Wennermark, who runs a business called Man and Machine Consulting. We struck up an online relationship and made plans.
We’d do our aero testing at Watkins Glen International, during a David Murry track day. These two-day events are run as a 7-hour open track with no run groups, which would allow me to swap parts, make adjustments, and enter and exit the track at will. This would allow me to investigate more than just roofline shape, and so I added wings, vortex generators, and different front-end options including the R-package lip, airdam, and a splitter.
I wanted to do this as scientifically and unbiased as possible. An important part of that is not being influenced by manufacturers. I wasn’t; I paid for everything at full retail price. Also worth noting is I don’t sell aerodynamic parts or services. This was entirely an intellectual pursuit, not the start of a business venture.
Sensors, data, and Jeremiah’s genius
Before meeting Jeremiah in person, I got to know him through an exchange of Google docs and spreadsheets. I soon realized he was the real deal, and I began to feel like a hack. I picked him up at the airport and was equally surprised by his youth and his luggage. Let’s just say he doesn’t travel lightly. His portable travel kit consists of two enormous cases with over $20,000 worth of sensors and monitoring equipment that can be bolted to any car.
Jeremiah started by mounting a pitot tube on the nose of the car to measure dynamic air pressure. Coupled with sensors inside the car to measure barometric pressure, ambient air temperature, and relative humidity, he can normalize all the factors between runs. This was crucial to our testing, especially when we suddenly got an 11 mph headwind while testing two different wings back to back.
The environmental data is sent through an analogue CAN bus signal converter, which allows Jeremiah to make any flat road into his own wind tunnel. Unlike many consumer accessible wind tunnels, he measures the real effect of rolling tires across asphalt. In fact, during one of the many on-track delays, we used the parking lot for the rolling resistance tests.
To measure suspension position, he installed both linear and rotary potentiometers on the suspension components. Even more trick, Jeremiah designed custom load cells that install quickly beneath the coil springs. These flat metal discs contain sensors known as strain gauges that change electrical resistance as weight is applied to them. Temperature sensors on the strain gauges compensate for that variable, as well. All of this combined data is then amplified and sent to the CAN bus. From these sensors, we could tell exactly what the car was doing at every point on the track. Most importantly, this included how much downforce the car made at various speeds.
All of that information gets sent through a wiring harness that resembles a spinal cord, both in thickness and complexity. Built by hand, Jeremiah spent over 50 hours laying the tefzel wire in a concentric pattern using autosport and DTM connectors, raychem sleeves, ATUM connector booting, and terminated wires using a DMC turret crimp tool. All which is accompanied by an OEM-like wiring diagram and pinout sheet.

50 hours went into this spinal cord
The spinal cord connects to the brains of the system, a Motec C185 allowed for advanced onboard math functions, additional logging memory, display creator, and additional inputs. The data logger is used in conjunction with Motec i2 Pro and Matlab for analysis.
In the cockpit, Jeremiah installed push-to-talk buttons on the steering wheel for driver confirmation of coast down and quasi-steady state test initiation, and a Motec dash display for air speed, GPS speed, etc. He also installed a Racelogic VBOX dual-camera GPS logging video system, which would allow us to compare what our drivers were doing on track, based on their location, rather than lap time.

Cockpit with logging confirmation buttons
Setting up the test mule
All of that expensive hardware went on a run-of-the-million Spec Miata, originally part of Rosmar Racing’s rental fleet. It’s been modified with a cold-side intake, header, and Megasquirt PNP2 engine management system. Berg Racing of Webster, New York tuned the engine conservatively for endurance racing, and it made 120 horsepower on their Mustang dyno.
The exterior has also been modified beyond Spec Miata rules and resembles what a lot of other tracked Miatas look like these days. The front has a vertical airdam, but with a removable 4” splitter extension bolted to the underside. The car also has side skirts with wheel spats, vents on the back of the front fender, and no rear bumper.
I made my own aluminum wing stands to hold up a 60” 9 Lives Racing wing. I set the wing angle at a five-degree angle of attack, but because of unintentional negative chassis rake, the wing angle measured 4.6 degrees. The wing is mounted at roof height, with 12” x 12” end plates, and no Gurney flap.
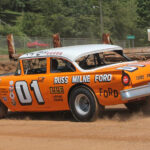
The day before the Watkins Glen test, we brought the car to Pineview Run Auto & Country Club, a private race track in Central New York. CEO and founder Todd Milton is no stranger to racing cars or aerodynamics, as he raced dirt track and experimented with aero before computers made it much easier. When we told Todd about the tests we were running at Watkins Glen, he was gracious enough to let us use his entire facility for a private pre-test day.
The Pineview Run racetrack is a 1.1-mile rollercoaster of 2nd and 3rd gear corners. Not the ideal venue to test high-speed aero, but a great place to get our drivers familiar with the car, set up the sensors, and shake down the kinds of problems that only occur on track. There were minor clearance problems with one sensor, and other small adjustments to be made. It didn’t help that it rained—a theme that would persist throughout the three days. We finished setting up the car just in time to load and then race the RV and trailer over to Watkins Glen, arriving just two minutes before the gates closed for the evening.

Watkins Glen testing
Watkins Glen is a good place to test aerodynamics. In addition to its high speeds, the back straight is long and flat enough to correct for the small gradient, making repeated steady-state and coast-down tests possible.
To make sure all the measurements were taken exactly, Jeremiah used a laser and shims to correct for any slope in the garage floor, and marked the exact spot where the car would be measured before and after each run. This allowed him to take repeated measurements on things like wing angle, splitter angle, rake, etc.
Our driving team would run the manual tests on the back straight, and provide subjective feedback on how each change felt. Our first driver, Anthony Zwain, knows his way around a race car and the track, and has a recent ST3 lap record at Watkins Glen. Zwain owns EDGE Motorsports in Mountain View, California, a maintenance and performance shop for BMW, Porsche, Mini, and Subarus. Our second driver Alyssa Merrill is a young, local hot-shoe with experience racing Miatas at the Glen.
We wanted to let our drivers loose to get their opinions on how the car felt, and also get data on top speed and fastest lap times. It didn’t go exactly like that, because it was more important to get the static speed and coast-down tests done first. The regular test procedure was to reach 90 mph on the back straight, and then hold in a button on the steering wheel while maintaining steady state conditions. After a few seconds, the driver would disengage the clutch and transition into the coast-down test, gradually letting drag decelerate the car to 70 mph.
To calculate drag, you have to factor in the effective mass used while generating drag force values, which Jeremiah compiled from the vehicle’s static weight with driver, and additional dynamic weight due to wheel, tire, and brake disc inertia. He then factored in the rolling resistance, and measured the frontal area with each configuration, which gives the corrections for the final drag resistance values.
During the test we did our best to make everything as consistent and repeatable as possible, but there are always factors out of one’s control. For one, in central New York, the only thing predictable about the weather is that it isn’t. It was dry, it was wet, it was often in between, and twice the track was closed because the corner workers couldn’t see each other through the fog.
Temporary track closures are something you can count on at Watkins Glen. The track has steel armco guardrails in the run-off areas, so off-track excursions are announced with a loud “BANG,” and result in second-hand cars with baby blue racing stripes.
Between the iffy weather and track closures, we only got about half way through our testing program. Significantly, we didn’t get to test different front ends. I had a stock front end on hand, as well as a R-package lip, and we wanted to see how those compared against the airdam and splitter. Alas, when someone hits the wall at Watkins Glen, everyone pays the price.
At this David Murry Track Day, oh what a price. Most of the cars were quarter-million dollar exotic supercars, and that’s before you add the race kits, spares, stacker tow rigs, and crew. We shared the track equally with race cars from Ferrari Challenge, Lamborghini Super Trofeo, IMSA, and even some open-wheel racers.
Jeremiah joked that a single wheel from our garage neighbor’s McLaren might be worth more than my entire car. He was only $1000 off. At least five times over the weekend one of the exotics would ‘earn their stripes,’ spreading carbon fiber confetti around the track as if it were crop seed.
So when you show up to such a track event with a beater Miata, it’s important to one-up them with your skill and professionalism. Our multiple computer monitors and data acquisition setup served them their first notice.

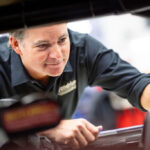
Jeremiah, at the office
We then made sure to leave the hood pins unlatched in our first run. As you might expect, the hood opened violently just after pit out. Thankfully there’s a small gap under the hood that our driver could see through, so we didn’t have to close the entire track down for a tow. We also got lucky that the windshield didn’t break.This good fortune allowed us to do a full parade lap with the hood smashed flat against the window; our statements on skill and professionalism were made with authority.

Smashed hood is helping to keep property values low in our neighborhood.
Perhaps the car gods looked favorably upon this humble tribute, because after repairing the damage (using parts donated from the parking lot), the remainder of the two-day test proceeded without incident. Weather, track closures, and other delays meant I didn’t get to test everything I wanted to. Many parts never left the truck. As it happens in the real world, there were complications and delays out of anyone’s control. Nevertheless, we gathered a bunch of real-world data, and put a significant dent into the gaps of Miata aerodynamic knowledge.
Summary data
In two days of testing, I tested five configurations of tops (open, chop top, OEM hardtop, hardtop with vortex generators, fastback), three wing options (no wing, cheap dual wing from eBay, 9 Lives Racing wing), and a splitter (on or off).
I’ll dive into the details of this test in follow-up articles, examining the different tops and wings I tested, and how they interacted with each other. In the meantime, here’s how the different configurations stacked up. If you’re familiar with drag and lift figures, you can skip ahead, but for those of you who need aren’t total nerds, here’s what the values mean.
- Cl – Coefficient of lift is how much aerodynamic lift the car generates. A negative number means downforce, which is good; a positive number (lift) is bad. Coefficient of lift is measured at the front and the rear, and so the table lists both Cl Front and Cl Rear.
- Total Cl – This is front and rear Cl added together. Oftentimes a gain at one end is offset by a loss at the other. This might be because of downstream effects (what happens at the front of the car affects everything behind it), or because the car tilts forward (positive rake) or backwards (negative rake). In any case, you can look at the Total Cl field as how much downforce (or lift) the car generates.
- Cd – Coefficient of drag is how streamlined the car is. A lower number is better. If you’re familiar with published Cd values and my data seems high to you, it’s because manufacturer-published data is with the windows up, in a wind tunnel; all of my data is with the windows open, on a race track.
- HP @ 100 mph is another way to conceptualize drag. How much power is used to maintain speed at 100 mph, and how much is left over? Obviously the lower the number the better, especially when you only have 120hp.
- L/D% – The lift-to-drag ratio, also called aerodynamic efficiency, is the amount of downforce (as a positive number), divided by the coefficient of drag. Most street cars have a negative value (because lift), while most race cars have a positive value (because downforce). For example, the lift-to-drag ratio of a street Miata is around -1.0, a NASCAR stock car is around 1.0, and a LeMans prototype is somewhere north of 5.0.
| Vehicle Configuration | Cl Front | Cl Rear | Total Cl | Cd | HP @ 100mph | L/D% | Lap | MPH |
| Fastback, Airdam, Splitter, 9LR wing | -0.12 | -1.09 | -1.20 | 0.41 | 44.81 | 2.97 | 2:17.44 | 120.63 |
| Hardtop, Airdam, Splitter, 9LR wing | -0.17 | -0.84 | -1.01 | 0.48 | 52.78 | 2.11 | 2:19.39 | 117.03 |
| Chop Top, Airdam, Splitter, 9LR wing | -0.20 | -0.33 | -0.53 | 0.45 | 49.40 | 1.19 | 2:20.52 | 118.91 |
| Open top, Airdam, Splitter, 9LR wing | -0.20 | -0.23 | -0.43 | 0.43 | 47.16 | 1.01 | 2:20.52 | 120.06 |
| Hardtop w/ VGs, Airdam, Splitter, 9LR wing | -0.20 | -0.61 | -0.82 | 0.52 | 57.58 | 1.57 | 2:20.79 | 115.11 |
| Hardtop w/ VGs, Airdam, No Splitter, 9LR wing | 0.18 | -0.64 | -0.47 | 0.53 | 58.75 | 0.88 | 2:22.17 | 114.82 |
| Hardtop, Airdam, Splitter, Ebay wing | 0.03 | -0.58 | -0.56 | 0.55 | 60.79 | 0.90 | 2:22.23 | 113.78 |
| Fastback, Airdam, No Splitter, No wing | 0.16 | 0.18 | 0.35 | 0.38 | 42.00 | -0.80 | 2:22.69 | 123.06 |
| Chop Top, Airdam, No Splitter, No wing | 0.11 | 0.20 | 0.31 | 0.48 | 52.93 | -0.64 | 2:24.02 | 117.81 |
| Hardtop w/ VGs, Airdam, No Splitter, No wing | 0.22 | 0.38 | 0.59 | 0.49 | 54.53 | -1.20 | 2:25.39 | 117.19 |
Drag and lift are important measurements, but the only thing that truly matters is lap time. In the previous table, I included the simulated lap time. The program I use for this, OptimumLap, is a single-point-mass calculator, which means that Front Cl and Rear Cl are not factored separately, but as a Total Cl value. In the real world, aero balance matters a lot, but the tool doesn’t factor that in. Similarly, the program doesn’t account for elevation and camber changes on the track, and so it isn’t perfect for calculating lap times. However, OptimumLap is quite useful for comparing different configurations, as I’ve done here. For the simulations I used a Miata at 2300 lbs, 120 hp, 1.2 lat-G, 1.1 long-G, and simply changed the drag and lift values to those in the table. I also included top speed, as calculated by the program, since this is a popular discussion point.
Before looking at the lap times, you might have thought that aerodynamic efficiency (L/D%) would be a good indicator of lap time. The reason it isn’t is because downforce is much more important than drag. At most race tracks, you could sort on the Total Cl field and lap times would also fall in line. At faster tracks like Watkins Glen, and when you have a car with very little power, drag plays a role. But for the average race car on a typical road course, forget about drag altogether and go for maximum downforce.
Conclusion
As it relates to this Miata at Watkins Glen, I can conclude the following:
- A 4″ splitter is worth about 1.4 seconds over a vertical airdam alone.
- The effectiveness of a wing depends on the roof: An open top generates 40% of the downforce of an OEM hard top; A fastback generates 130% more downforce than an OEM hardtop.
- Using a cheap dual-element wing will turn a faster lap time than no wing at all.
- The configuration with the highest top speed (fastback, but with no other aero), had the second slowest lap time.


