
The complexity of an assembled engine means that its horsepower or torque output can easily be lied about. You’ve probably walked up to someone at a car show and looked into the vehicle’s engine compartment as the owner tells you about how this engine makes 600 horsepower. In most cases, it’s impossible to call their bluff. After all, what parts are inside the engine? Are they box-stock components, or did someone have a field day with a die-grinder doing port work?
An extremely experienced ear and eye can spot some tell-tale signs in an engine bay and call BS on a power claim with some confidence, but for the hard truth, you need an objective testing system. If you are lucky, the owner has a dynamometer (“dyno”) sheet to confirm their claims about the engine’s output.
But even dyno sheets can lie—seriously.
Here are a couple of easy ways to sort fact from fiction.
This thorough breakdown comes from Banks Power and explains not only how a dynamometer works but also how the operator can leverage some of the dyno’s reporting to create deceptive results. Fair warning: The video is dense with technical information.
First, we must define what a dynamometer is. Essentially, a dyno is a machine that measures engine torque. Pretty simple, right? Well, it can be. Measuring torque output is done by placing a load on the engine or drivetrain of a vehicle and evaluating how the engine reacts. For engine dynos, the load is often produced by connecting the back of the crankshaft to an external water pump. Chassis dynos—probably what you think of when someone says “dyno”—generate engine load less directly: They place the vehicle’s driven wheels on weighted rollers that resist the tires’ motion via an electrical or a hydraulic system. Whatever the method the dyno setup uses to put stress on the driveline, the goal is to measure torque, and that is when the math comes in.
Any dyno sheet has a mountain of information besides the two tracer lines—one for horsepower, one for torque—and the peak power figures. The first thing that Banks points out that most people don’t think about is the sweep time.
Sweep time tracks how long it takes for the engine to pull through the load placed on it by the dyno from low rpm to high rpm. A long sweep time would mean the engine is at wide-open throttle for an extended period of time. Think of trying to drive up a pass in the Rocky Mountains in a three-cylinder Geo Metro: The car will probably make the grade, but the engine will be at full throttle for a long time.
The longer the sweep time, the more realistic the power number on the results sheet. As the video points out, if a dyno operator says the sweep cannot be longer than six seconds or so due to intake or exhaust temperature, for instance, your engine is not capable of safely generating peak power for longer than six seconds. Sweep time should reflect how you intend to use the vehicle.
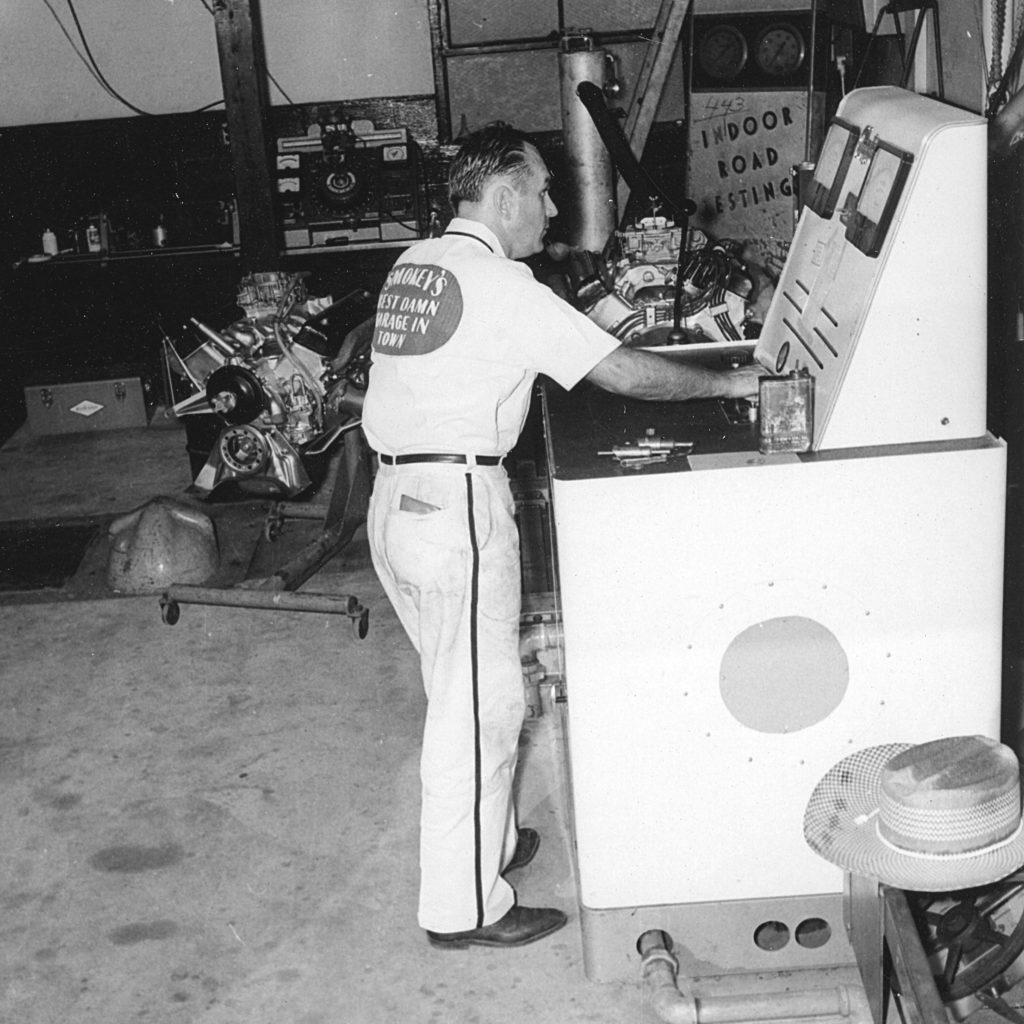
NASCAR car owner, mechanic and innovator Henry “Smokey” Yunick working in his Daytona Beach shop, “The Best Damn Garage in Town.” (Photo by ISC Images & Archives via Getty Images)
Then there are the other math items that we don’t talk about much. The main one is the correction factor. This is a method of standardizing results across varying local conditions. This is what allows you to use dyno sheets for comparison purposes—if you know what you are looking for. Not all dyno operators use the same correction factor, since this is based on air density and thus factors in that day’s temperature, humidity, and ambient pressure. Using the wrong correction factor—or doctoring the input for the day the testing is performed—can yield an optimistic graph that makes for great bragging … until someone smart enough takes a look at it and points out the lies.
Another interesting item brought up in the video is smoothing. This is a well-intentioned edit to a dyno graph, designed to make the lines less jagged and easier to read, but smoothing can make for misleading charts. Essentially, this process involves editing the horsepower and torque curves to remove mathematical noise.
In short, dynamometers are incredibly complicated. It is easy to take them for granted and put too much trust in a casual glance at the results sheet. Luckily you now know more than you did—unless you clicked on this article already an expert. In that case, tell us what we got right. There is also much more information in Banks Power‘s video than we examined in this article, so be sure to give it a watch to learn even more.


